Debugging allows you to analyze the bugs of a program. Most newbie developers use the Serial.print() function to debug their program. But using traces is not very convenient for debugging a program. Not knowing in general where the problem comes from, it is necessary to position many traces. And you have to modify them many times before identifying the cause of the problem. Using a debugger is much more efficient and allows you to analyze bugs much faster than with traces.
When we debug a program, it is the debugger who controls the microcontroller. The debugger allows you to run the program step by step in order to analyze its behavior. It allows to inspect the variables, registers and memory of the microcontroller. The debugger generally makes it possible to modify the state of the program (variable, register, memory, etc.) when its execution is stopped.
A JTAG interface provides direct access to the internal resources of integrated circuits, making it an essential mechanism for debugging microcontroller-based systems.
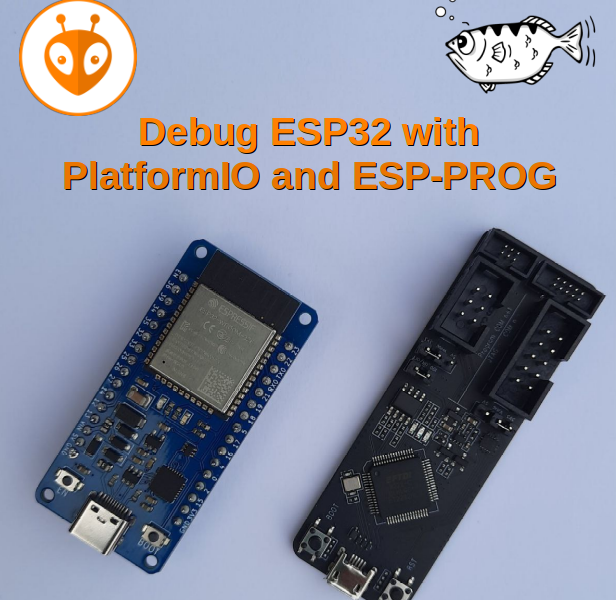
In this tutorial, I explain how to debug a program on an ESP32 through its JTAG interface, using Visual Studio Code and PlatformIO. I detail installation and use on Linux, but it’s very similar on Windows.
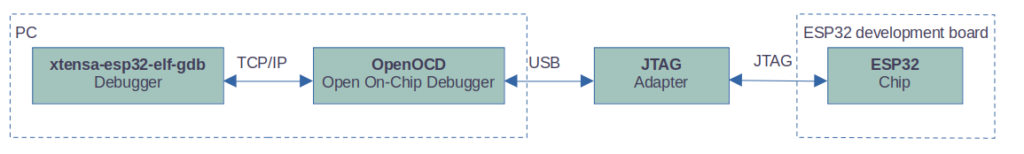
The debugger I use is GDB (GNU Debugger), more precisely xtensa-esp32-elf-gdb which is the version of GDB adapted to the ESP32 Wroom architecture that I use. OpenOCD (Open On-Chip Debugger) acts as an interface to communicate with the ESP32 microcontroller through the ESP-PROG JTAG adapter.
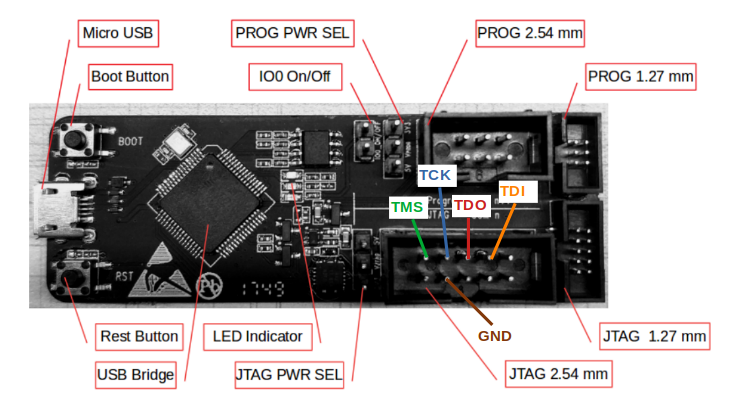
JTAG pins
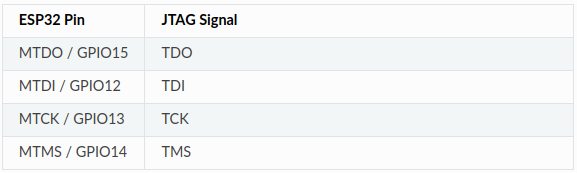
A JTAG interface is composed of 4 main pins:
- TDI (Test Data In)
- TDO (Test Data Out)
- TCK (Test Clock)
- TMS (Test Mode Select)
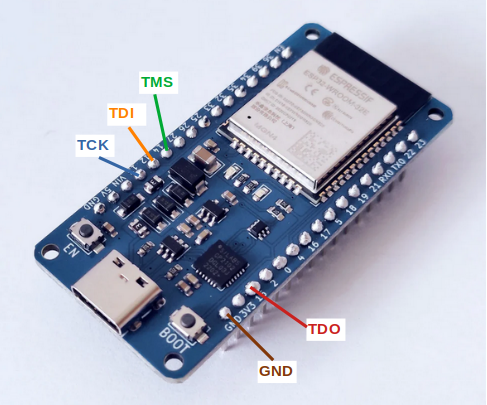
The JTAG interface signals are connected to the following pins of the ESP32:
The JTAG pins on the ESP-PROG:
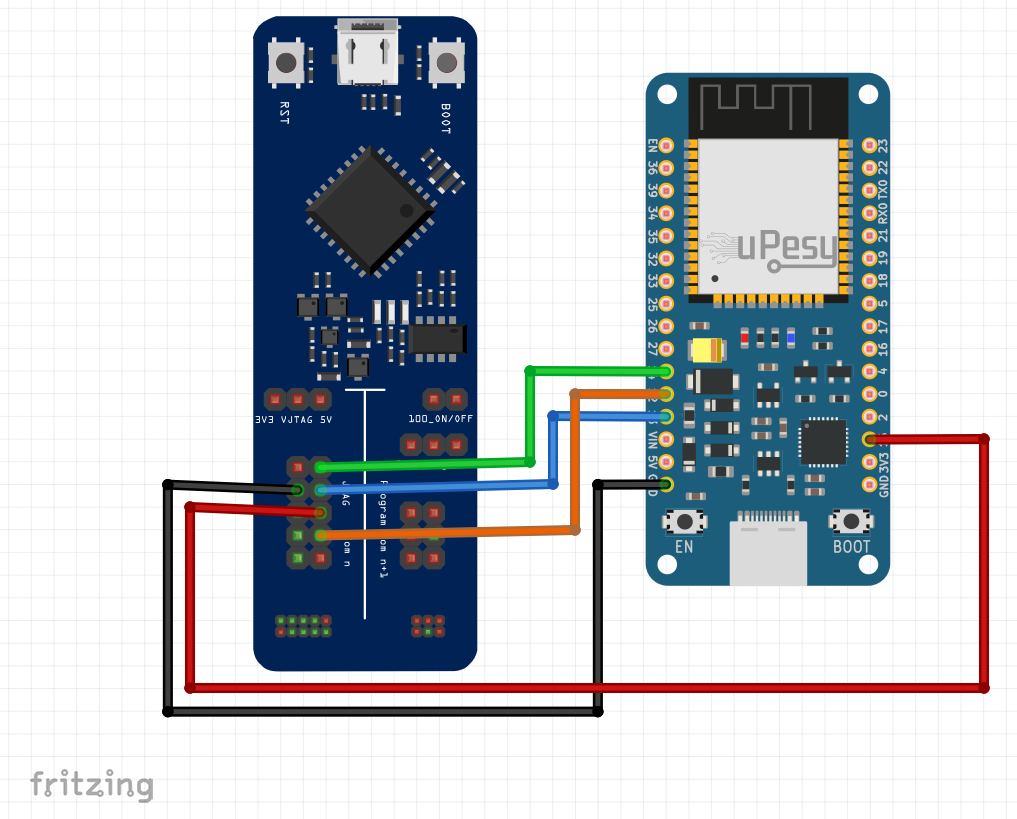
Connecting ESP-PROG and ESP32
The ESP-PROG is connected to the PC via a USB cable which will be used for communication between the two devices and for the power supply of the ESP-PROG.
It is not necessary to connect the ESP32 card to the PC. Indeed debugging of the ESP32 will be carried out via the JTAG protocol through the ESP-PROG, and the program will also be uploaded to the ESP32 through the ESP-PROG. It is therefore sufficient to connect the USB socket of the ESP32 card to a USB power supply.
Configuration of the communication between the PC and the ESP-Prog
You must follow the installation procedure detailed in the PlatformIO documentation. On Linux, simply install the udev rules by entering the following commands in a terminal:
curl -fsSL https://raw.githubusercontent.com/platformio/platformio-core/develop/platformio/assets/system/99-platformio-udev.rules | sudo tee /etc/udev/rules.d/99-platformio-udev.rules
sudo service udev restart
Installing Visual Studio Code and PlatformIO
The procedure for installing Visual Studio Code and PlatformIO is described in my tutorial Program a Raspberry Pi Pico with Visual Studio Code and PlatformIO.
For the moment the GDB component of the toolchain provided by Espressif requires the installation of libpython2.7.so.1.0, to solve this problem it is enough to install the package python2.7-dev.
sudo apt install python2.7-dev
PlatformIO configuration file
You must modify the platformio.ini configuration file which is generated by default.
The speed of the serial monitor that is used to display traces (Serial.print):
monitor_speed = 115200
The name of the debug tool used to debug our map, we use esp-prog:
debug_tool = esp-prog
We will also upload the program to the ESP32 through the ESP-PROG adapter using the esp-prog protocol:
upload_protocol = esp-prog
The initial debugger breakpoint, which we set in the setup function:
debug_init_break = tbreak setup
Here is the content of the modified platformio.ini file:
; PlatformIO Project Configuration File
;
;   Build options: build flags, source filter
;   Upload options: custom upload port, speed and extra flags
;   Library options: dependencies, extra library storages
;   Advanced options: extra scripting
;
; Please visit documentation for the other options and examples
; https://docs.platformio.org/page/projectconf.html

[env:upesy_wroom]
platform = espressif32
board = upesy_wroom
framework = arduino
monitor_speed = 115200
upload_protocol = esp-prog
debug_tool = esp-prog
debug_init_break = tbreak setup
The program to debug
We are going to debug the following program, which contains a bug that we want to identify and fix. Copy and paste this code into the main.cpp file:
// Deboguer un ESP32 avec PlatformIO
// via son interface JTAG
// https://tutoduino.fr/
// Copyleft 2023

#include <Arduino.h>

int test(int a)
{
  int result;
  result = 1000 / a;
  return result;
}

void setup()
{
  Serial.begin(115200);
  pinMode(LED_BUILTIN, OUTPUT);
  delay(1000);
}

void loop()
{
  int randNumber, result;

  randNumber = random(20); // Generate a pseudo-random between 0 and 20

  result = test(randNumber);

  // These kind of traces are not required anymore with a debugger
  Serial.print("Calling test function with value ");
  Serial.print(randNumber);
  Serial.print(" returned ");
  Serial.println(result);

  digitalWrite(LED_BUILTIN, HIGH); // turn the LED on
  delay(500);                      // wait for 500ms
  digitalWrite(LED_BUILTIN, LOW);  // turn the LED off
  delay(500);                      // wait for a 500ms
}
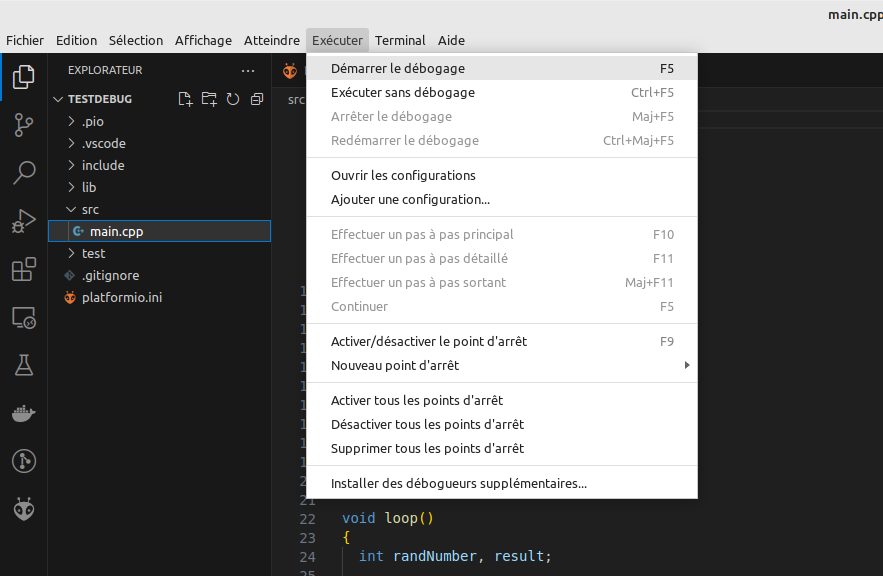
You must then start debugging the program by clicking on Run/Start debugging:
The program runs until the setup() function is called, we have indeed configured this initial debugger breakpoint in the platformio.init configuration file with debug_init_break = tbreak setup.

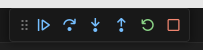
It is now possible to step through the program using the debugger control menu located at the top middle of the screen:
You can then execute the program step by step, set other breakpoints, continue execution until the next breakpoint, inspect memory and variables…
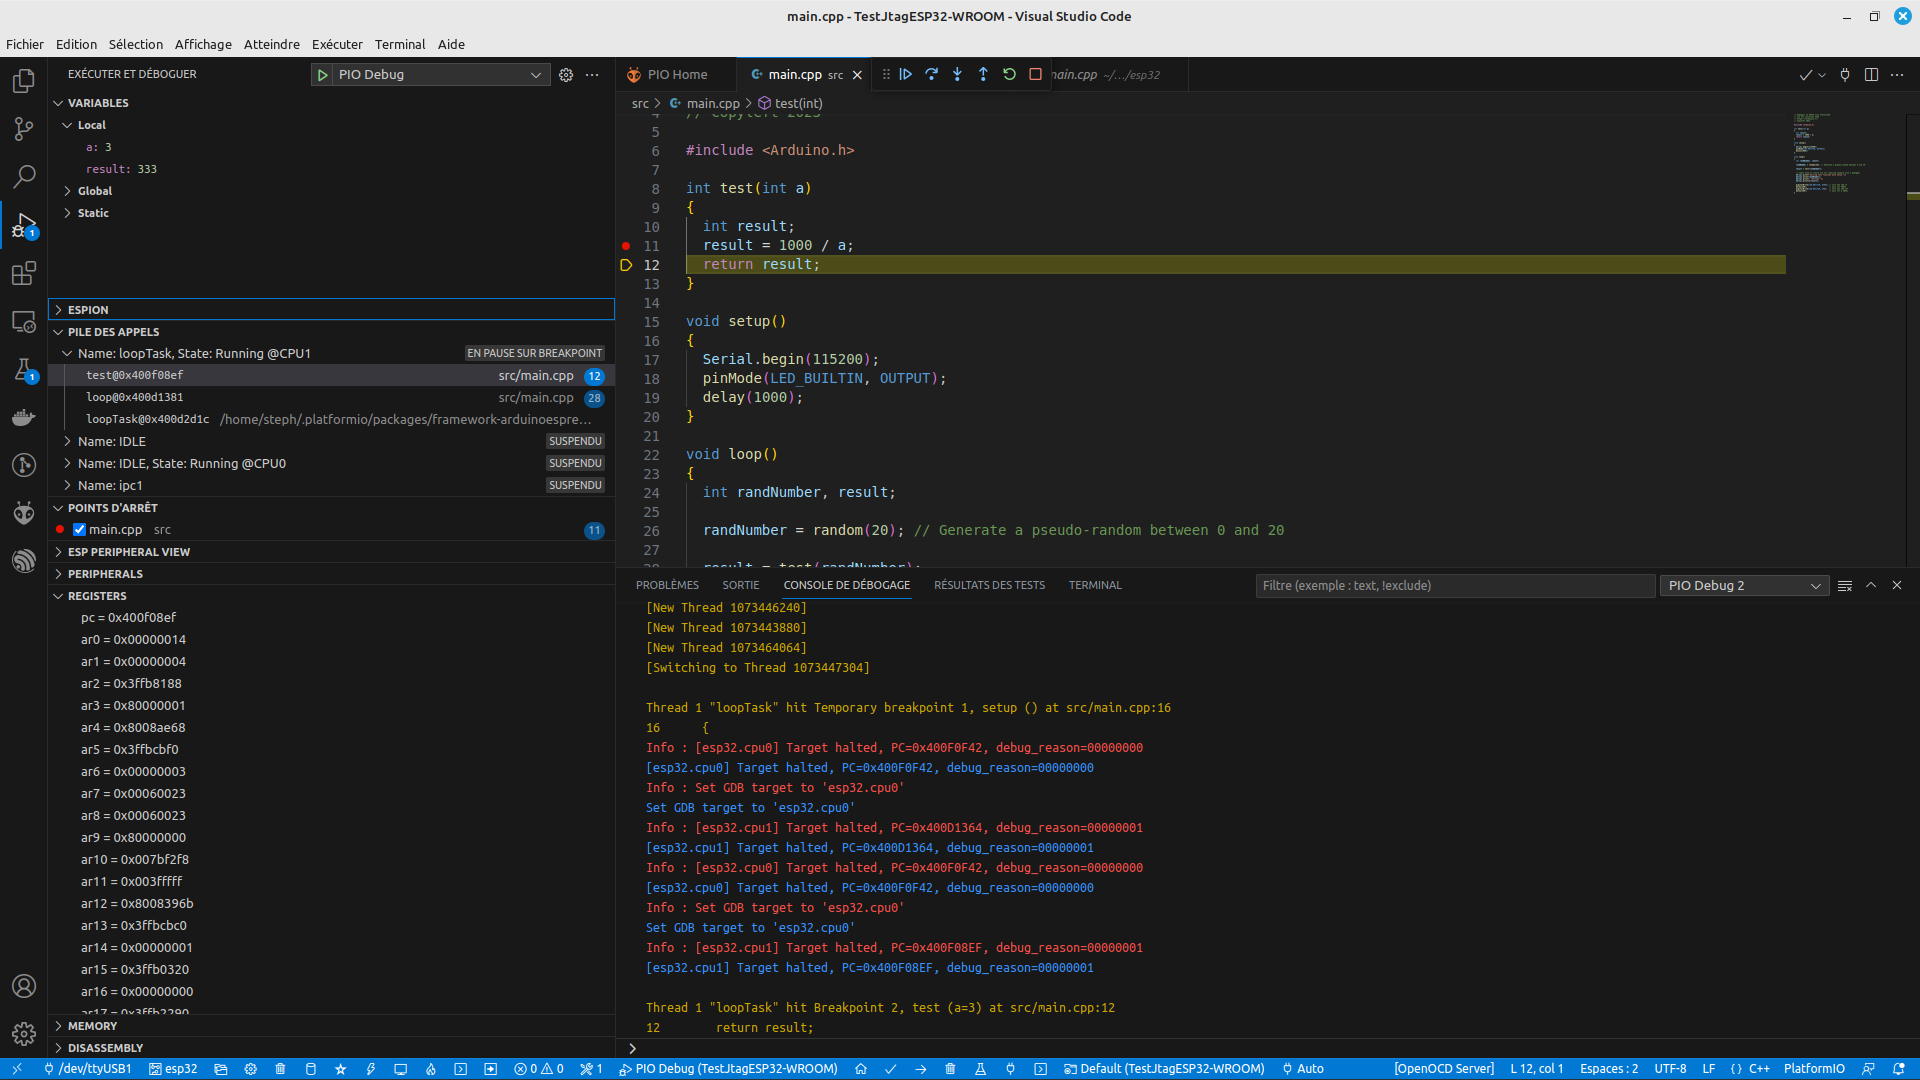
Our program contains a bug that you should have identified. There is indeed a division by zero in the test() function if the parameter passed as an argument is equal to zero. As the test() function is called with an argument which is a random number between 0 and 20, this bug will occur randomly and generate an exception.
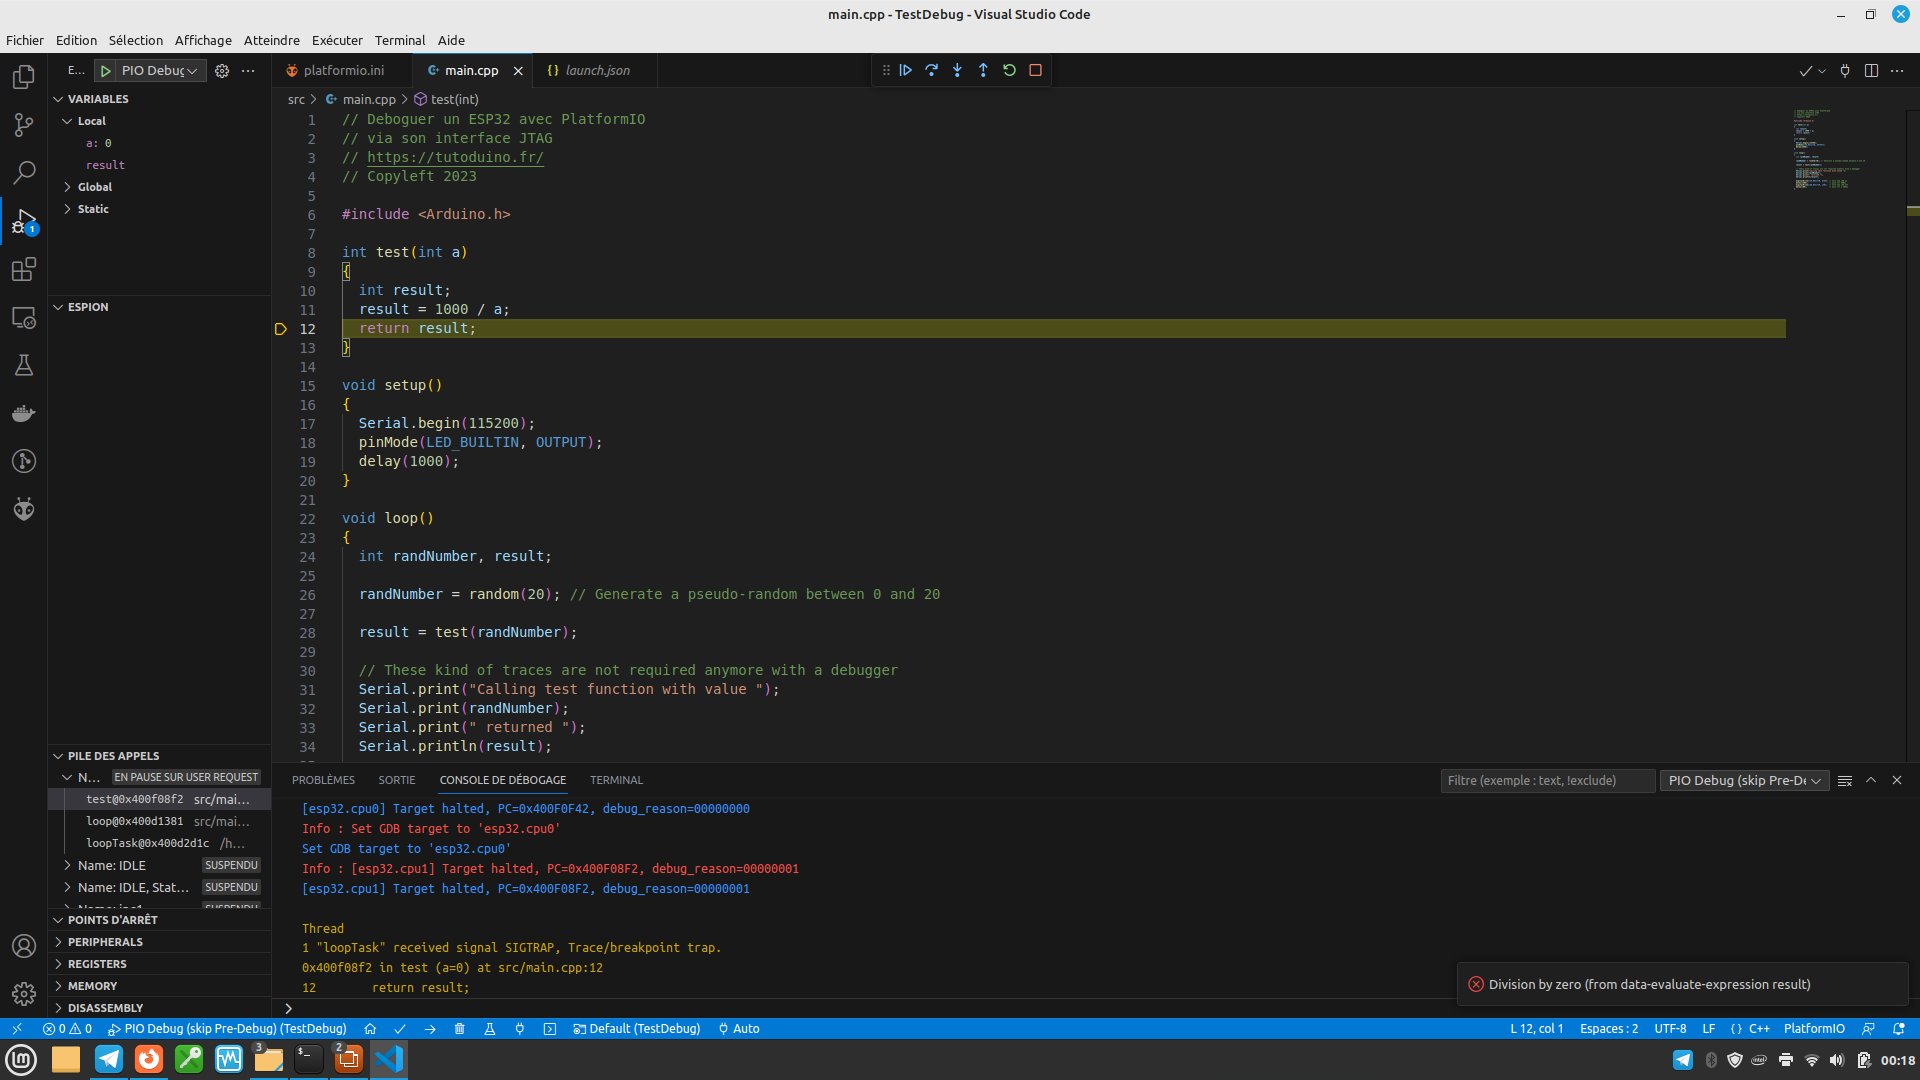
We therefore click on the “Continue” command of the debugger to continue the execution of the program, and wait for it to crash. At this time the debugger provides all the information necessary to identify and correct the bug: we see that the program is stopped in the test() function and that the variable a is equal to zero. PlatformIO even mentions at the bottom right the information “Division by zero (from data-evaluate-expression result)“, we couldn’t be clearer!
Error starting debugging
With the version I’m using (Visual Studio Code 1.81.0, PlatformIO Core 6.1.9 Home 3.4.4, OpenOCD v0.11.0-esp32-20220706), I encounter several errors when starting the debug program. I am still investigating these errors :
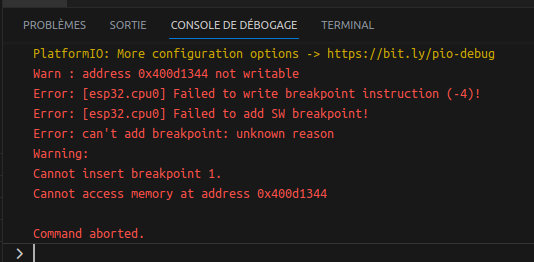
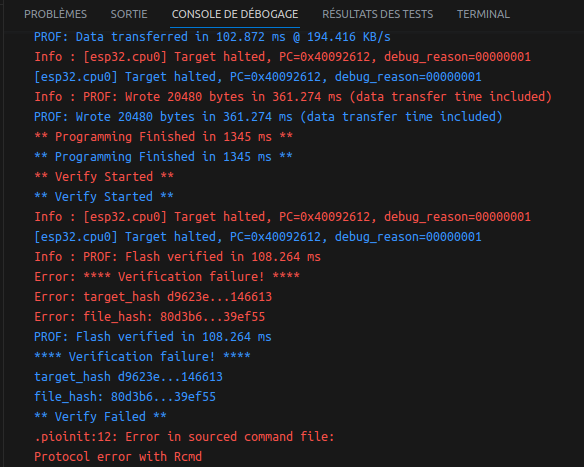
Generally I encounter the above two errors one after the other, and only after the third boot does it work. I keep trying to find a solution to this problem, but without success so far. So don’t hesitate to restart debugging and answer “Yes” if Visual Studio Code asks you to start another instance of ‘PIO Debug’. If everything goes without error, the debugger will stop at the breakpoint configured in the setup() function.
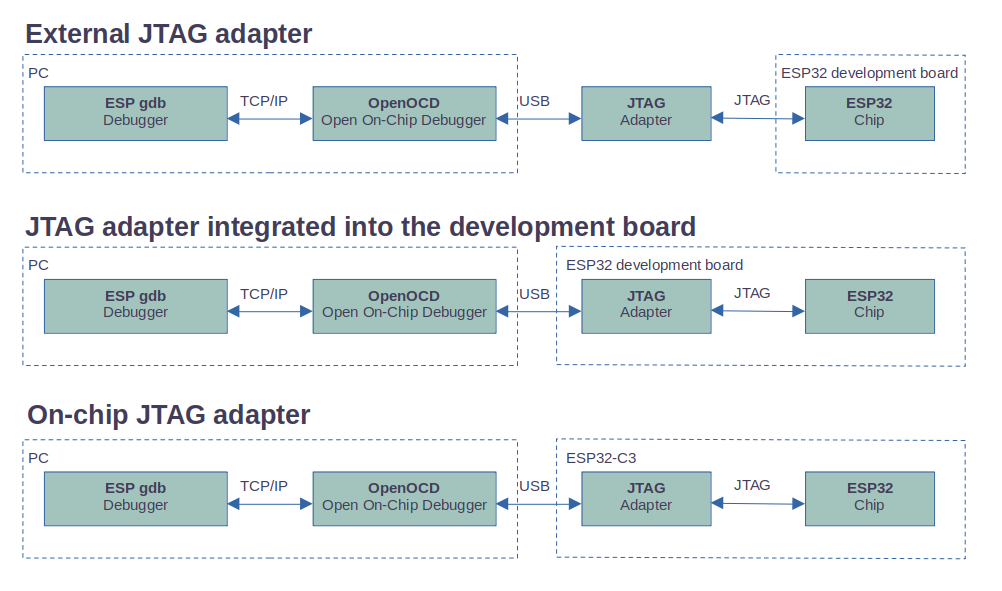
Do you need ESP-PROG?
The ESP-PROG is an external JTAG adapter based on the FT2232H chip, which is a USB to UART interface IC.
Some ESP32 development boards integrate this FT2232H component and therefore do not require the use of an external JTAG adapter. You can directly debug the board by connecting it with a USB cable to your PC.
The ESP32-C3 microcontroller integrates a JTAG adapter through its USB Serial/JTAG controller. Please see my tutorial https://tutoduino.fr/en/tutorials/debug-esp32/debug-an-esp32-c3-via-its-jtag-interface/
This tutorial is finished, do not hesitate to give your opinion and leave a comment, it will help me to improve it.
Thanks to Gotronic and uPesy for providing the ESP32-Wroom board that was used to make this tutorial!