In this tutorial, I explain how to debug a program on an ESP32-C3 microcontroller in Linux command line and with PlatformIO. The principle is simple, the GDB debugger (GNU Debugger) communicates with the ESP32 microcontroller via OpenOCD (Open On-Chip Debugger). OpenOCD is a server that allows GDB to interface with the ESP32-C3 through its JTAG interface.
Installing ESP-IDF
ESP-IDF (IoT Development Framework) is Espressif’s development environment for the ESP32-C3.
You must follow the ESP-IDF installation procedure for the ESP32 microcontroller detailed on this page: https://docs.espressif.com/projects/esp-idf/en/latest/esp32c3/get-started/linux-macos-setup.html
If the installation proceeds normally, you are able to compile and upload the hello_world example program to the ESP32-C3.
. $HOME/esp/esp-idf/export.sh
cd ~/esp
cp -r $IDF_PATH/examples/get-started/hello_world .
cd ~/esp/hello_world
idf.py set-target esp32c3
idf.py build
idf.py -p /dev/ttyACM0 flash
/dev/ttyACM0 is the USB port my ESP32C3 is connected to, under Linux.
You can then follow the correct execution of the program by opening a serial monitor:
idf.py -p /dev/ttyACM0 monitor
You will then see the traces of the hello_world program displayed:
Hello world!
This is esp32c3 chip with 1 CPU core(s), WiFi/BLE, silicon revision v0.4, 2MB external flash
Minimum free heap size: 330376 bytes
Restarting in 10 seconds...
Restarting in 9 seconds...
Restarting in 8 seconds...
Installing OpenOCD
I recommend installing OpenOCD by compiling its sources.
Follow the installation procedure described in: https://docs.espressif.com/projects/esp-idf/en/v3.3.4/api-guides/jtag-debugging/building-openocd-linux.html
sudo apt-get install make libtool pkg-config autoconf automake texinfo libusb-1.0
cd ~/esp
git clone --recursive https://github.com/espressif/openocd-esp32.git
cd ~/esp/openocd-esp32
./bootstrap
./configure
make
sudo make install
Configuring the ESP32-C3 onboard JTAG interface
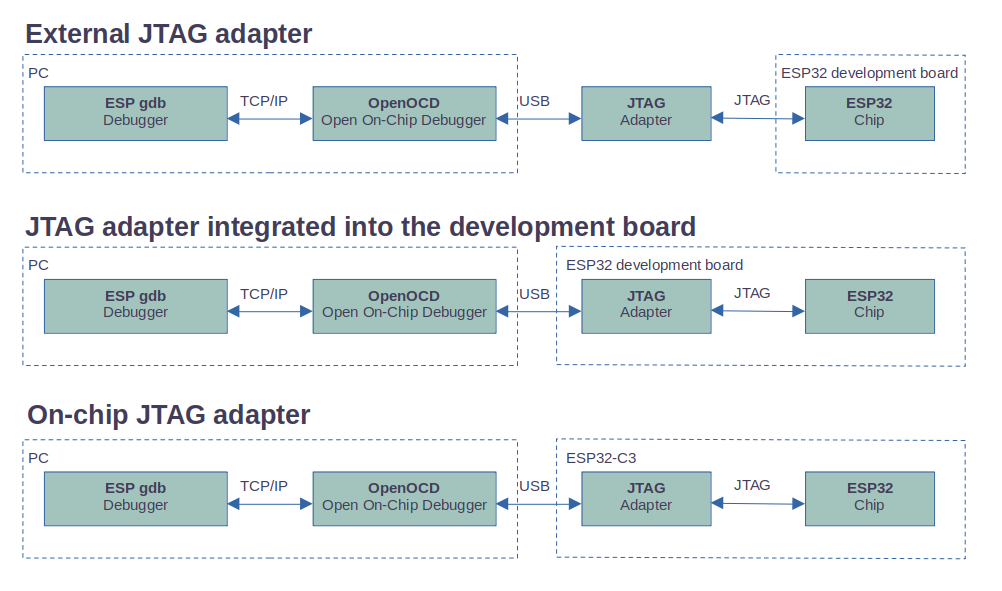
One of the interests of the ESP32-C3 microcontroller is that it integrates a USB Serial/JTAG controller. It is therefore no longer necessary to use an external adapter to debug it via the JTAG interface. This USB Serial/JTAG controller allows the simultaneous use of serial operations (serial monitor to display traces for example) and JTAG debugging using a single USB port.
Follow the detailed procedure on the page: https://docs.espressif.com/projects/esp-idf/en/latest/esp32c3/api-guides/jtag-debugging/configure-builtin-jtag.html
On Linux, simply install the udev rules by entering the following commands in a terminal:
curl -fsSL https://raw.githubusercontent.com/espressif/openocd-esp32/master/contrib/60-openocd.rules | sudo tee /etc/udev/rules.d/60-openocd.rules
sudo service udev restart
Run OpenOCD
Please carefully read the chapter "Avoid Failed to get flash maps Error", otherwise OpenOCD will raise an error when starting GDB.
You must launch the OpenOCD server by indicating that the target is an ESP32-C3.
cd ~/esp/openocd-esp32
openocd -f board/esp32c3-builtin.cfg
If all goes well, OpenOCD should be listening for gdb connection on port 3333
steph@my-computer:~/esp/openocd-esp32$ openocd  -f board/esp32c3-builtin.cfg
Open On-Chip Debugger v0.12.0-esp32-20230419-191-g4da79b3e (2023-08-11-13:46)
Licensed under GNU GPL v2
For bug reports, read
	http://openocd.org/doc/doxygen/bugs.html
Info : only one transport option; autoselecting 'jtag'
Info : esp_usb_jtag: VID set to 0x303a and PID to 0x1001
Info : esp_usb_jtag: capabilities descriptor set to 0x2000
Info : Listening on port 6666 for tcl connections
Info : Listening on port 4444 for telnet connections
Info : esp_usb_jtag: serial (D4:F9:8D:03:EF:80)
Info : esp_usb_jtag: Device found. Base speed 40000KHz, div range 1 to 255
Info : clock speed 40000 kHz
Info : JTAG tap: esp32c3.cpu tap/device found: 0x00005c25 (mfg: 0x612 (Espressif Systems), part: 0x0005, ver: 0x0)
Info : [esp32c3] datacount=2 progbufsize=16
Info : [esp32c3] Examined RISC-V core; found 1 harts
Info : [esp32c3]  XLEN=32, misa=0x40101104
Info : starting gdb server for esp32c3 on 3333
Info : Listening on port 3333 for gdb connections
Debug a program with GDB
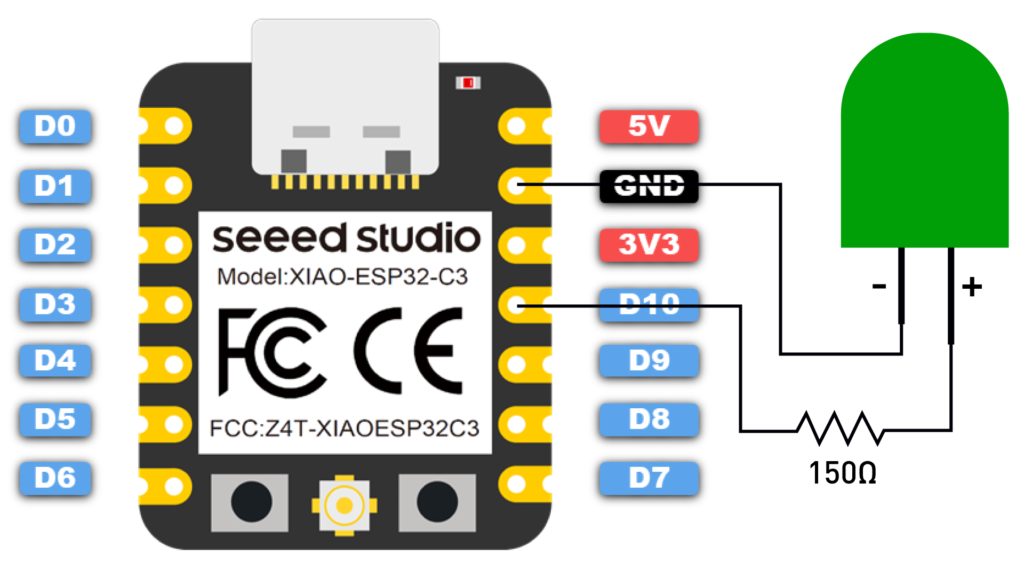
We are going to compile, flash and debug a program that flashes an LED connected to PIN D10 of the ESP32C3.
Here is the blink_led.c program that we create in the ~/esp/blink_led directory:
// Clignotement d'une LED sur la PIN D10 de l'ESP32C3
// https://tutoduino.fr/
// Copyleft 2023

#include <stdio.h>
#include "freertos/FreeRTOS.h"
#include "freertos/task.h"
#include "driver/gpio.h"

#define BLINK_GPIO GPIO_NUM_10

static uint8_t s_led_state = 0;

static void configure_led(void)
{
    gpio_reset_pin(BLINK_GPIO);
    /* Set the GPIO as a push/pull output */
    gpio_set_direction(BLINK_GPIO, GPIO_MODE_OUTPUT);
}

static void blink_led(void)
{
    /* Toggle state of the LED */
    s_led_state = !s_led_state;
    /* Set the GPIO level according to the state (LOW or HIGH)*/
    gpio_set_level(BLINK_GPIO, s_led_state);
}

void app_main(void)
{
   printf("Hello world!\n");
   configure_led();
   while (1) {
        blink_led();
        vTaskDelay(1000 / portTICK_PERIOD_MS);
    }
}
To compile and flash this program, copy the sdkconfig file and CMakeLists.txt from the hello_world example directory used previously:
cp ~/esp/hello_world/CMakeLists.txt ~/esp/blink_led/
cp ~/esp/hello_world/sdkconfig.txt ~/esp/blink_led/
Then modify CMakeLists.txt with the name of the blink_led project:
# The following lines of boilerplate have to be in your project's
# CMakeLists in this exact order for cmake to work correctly
cmake_minimum_required(VERSION 3.16)

include($ENV{IDF_PATH}/tools/cmake/project.cmake)
project(blink_led)
You can then compile and flash the program to the ESP32C3 with the following command:
cd ~/esp/blink_test
idf.py set-target esp32c3
idf.py build
idf.py -p /dev/ttyACM0 flash
You must then create a minimal configuration file for gdb named gdbinit in the ~/esp/blink_led directory with the following content:
target remote :3333
set remote hardware-watchpoint-limit 2
mon reset halt
maintenance flush register-cache
thb app_main
c
If you use a new terminal, you may have to execute ESP-IDF export shell before running GDB:
. $HOME/esp/esp-idf/export.sh
And then just run GDB with the name of the executable file in elf format:
riscv32-esp-elf-gdb -x gdbinit build/blink_led.elf
GDB starts and the program stops in the app_main() function, we have indeed configured this breakpoint in the GDB configuration file with the thb app_main command. The thb command (temporary hardware breakpoint) sets a temporary hardware breakpoint which will be automatically removed once reached.
tutoduino@my-computer:~/esp/blink_led$ riscv32-esp-elf-gdb -x gdbinit build/blink_led.elf
GNU gdb (esp-gdb) 12.1_20221002
Copyright (C) 2022 Free Software Foundation, Inc.
License GPLv3+: GNU GPL version 3 or later <http://gnu.org/licenses/gpl.html>
This is free software: you are free to change and redistribute it.
There is NO WARRANTY, to the extent permitted by law.
Type "show copying" and "show warranty" for details.
This GDB was configured as "--host=x86_64-linux-gnu --target=riscv32-esp-elf".
Type "show configuration" for configuration details.
For bug reporting instructions, please see:
<https://www.gnu.org/software/gdb/bugs/>.
Find the GDB manual and other documentation resources online at:
    <http://www.gnu.org/software/gdb/documentation/>.

For help, type "help".
Type "apropos word" to search for commands related to "word"...
Reading symbols from build/blink_led.elf...
warning: multi-threaded target stopped without sending a thread-id, using first non-exited thread
[Switching to Thread 1070137376]
app_main () at /home/steph/esp/blink_led/main/blink_led.c:31
31     printf("Hello world!\n");
JTAG tap: esp32c3.cpu tap/device found: 0x00005c25 (mfg: 0x612 (Espressif Systems), part: 0x0005, ver: 0x0)
Reset cause (3) - (Software core reset)
Hardware assisted breakpoint 1 at 0x420073d4: file /home/steph/esp/blink_led/main/blink_led.c, line 31.
[Switching to Thread 1070135492]

Thread 2 "main" hit Temporary breakpoint 1, app_main () at /home/steph/esp/blink_led/main/blink_led.c:31
31     printf("Hello world!\n");
(gdb)
We can now step through the program and inspect the variables.
Let’s set a temporary hardware breakpoint in the blink_led() function (thb blink_led), continue to run the program (c) and display the value of the s_led_state variable (print s_led_state):
(gdb) thb blink_led
Hardware assisted breakpoint 7 at 0x420073b4: file /home/tutoduino/esp/blink_led/main/blink_led.c, line 23.
(gdb) c
Continuing.
[Switching to Thread 1070135492]

Thread 3 "main" hit Temporary breakpoint 7, blink_led () at /home/tutoduino/esp/blink_led/main/blink_led.c:23
23      s_led_state = !s_led_state;
(gdb) l
18      gpio_set_direction(BLINK_GPIO, GPIO_MODE_OUTPUT);
19  }
20
21  static void blink_led(void)
22  {
23      s_led_state = !s_led_state;
24      /* Set the GPIO level according to the state (LOW or HIGH)*/
25      gpio_set_level(BLINK_GPIO, s_led_state);
26  }
27
(gdb) print s_led_state
$2 = 1 '\001'
(gdb)
Avoid “Failed to get flash maps” error
You will notice that OpenOCD raises following errors once you start GDB:
Info : [esp32c3] Found 8 triggers
Info : [esp32c3] Halt cause (3) - (Hardware Breakpoint/Watchpoint or EBREAK)
Info : accepting 'gdb' connection on tcp/3333
Info : [esp32c3] Halt cause (3) - (Hardware Breakpoint/Watchpoint or EBREAK)
Memory protection is enabled. Reset target to disable it...
Info : JTAG tap: esp32c3.cpu tap/device found: 0x00005c25 (mfg: 0x612 (Espressif Systems), part: 0x0005, ver: 0x0)
Info : Reset cause (3) - (Software core reset)
Warn : No symbols for FreeRTOS!
Error: Failed to get flash maps (-1)!
Warn : Failed to get flash mappings (-4)!
Error: Failed to get flash size!
Error: Failed to get flash size!
Error: Failed to probe flash, size 0 KB
Error: auto_probe failed
Error: Connect failed. Consider setting up a gdb-attach event for the target to prepare target for GDB connect, or use 'gdb_memory_map disable'.
Error: attempted 'gdb' connection rejected
To avoid this issue, several options are possible but I strongly recommend the third one (set D8 to HIGH during boot):
1/ Use “gdb_memory_map disable” command
You can start OpenOCD adding this command, but I faced severe issues while setting breakpoint and doing step by step in GDB using this option.
openocd -f board/esp32c3-builtin.cfg -c "gdb_memory_map disable"
2/ Use “set ESP_FLASH_SIZE 0” command
You can start OpenOCD adding this command, but I was not able to make this command working while debuging with PlatformIO.
openocd -f board/esp32c3-builtin.cfg -c "set ESP_FLASH_SIZE 0"
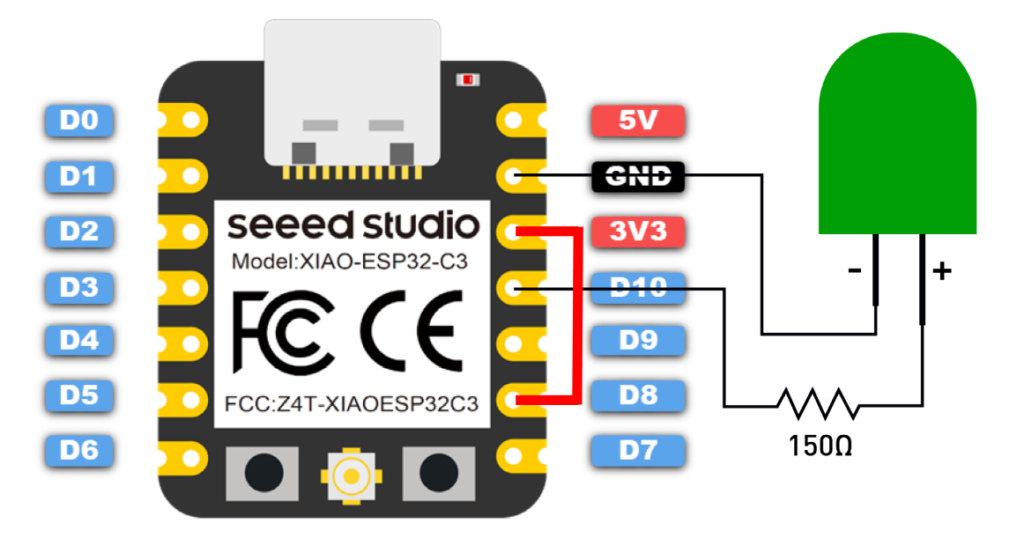
2/ Set D8 pin to HIGH during boot
As explained is chapter 7 of ESP32-C3 technical reference manual, ESP32-C3 has three strapping pins GPIO2 GPIO8 and GPIO9. These strapping pins are used to control chip boot mode during chip power-on or hardware reset. Documentation is quite unclear about this, but I observed that setting GPIO8 to HIGH (3.3V) during boot of the ESP32C3 fixes this problem perfectly!
Debug with Visual Studio Code and PlatformIO
Debugging with Visual Studio Code and PlatformIO is quite straightforward. You only have to install PlatformIO extension to Visual Studio Code and everything is ready!
Installing Visual Studio Code and PlatformIO
The procedure for installing Visual Studio Code and PlatformIO is described in my tutorial Program a Raspberry Pi Pico with Visual Studio Code and PlatformIO.
For the moment the GDB component of the toolchain provided by Espressif requires the installation of libpython2.7.so.1.0, to solve this problem it is enough to install the package python2.7-dev.
sudo apt install python2.7-dev
PlatformIO configuration file
You must modify the platformio.ini configuration file which is generated by default.
The name of the debug tool used to debug our map, we use esp-builtin:
debug_tool = esp-builtin
The initial debugger breakpoint, which we set in the setup function:
debug_init_break = break setup
The OpenOCD is configured as debug server:
debug_server =
  $PLATFORMIO_CORE_DIR/packages/tool-openocd-esp32/bin/openocd
  -f
  $PLATFORMIO_CORE_DIR/packages/tool-openocd-esp32/share/openocd/scripts/board/esp32c3-builtin.cfg
Here is the content of the modified platformio.ini file:
; PlatformIO Project Configuration File
;
;   Build options: build flags, source filter
;   Upload options: custom upload port, speed and extra flags
;   Library options: dependencies, extra library storages
;   Advanced options: extra scripting
;
; Please visit documentation for the other options and examples
; https://docs.platformio.org/page/projectconf.html

[env:seeed_xiao_esp32c3]
platform = espressif32
board = seeed_xiao_esp32c3
build_type = debug
framework = arduino
debug_tool = esp-builtin
debug_init_break = break setup
debug_server =
  $PLATFORMIO_CORE_DIR/packages/tool-openocd-esp32/bin/openocd
  -f
  $PLATFORMIO_CORE_DIR/packages/tool-openocd-esp32/share/openocd/scripts/board/esp32c3-builtin.cfg
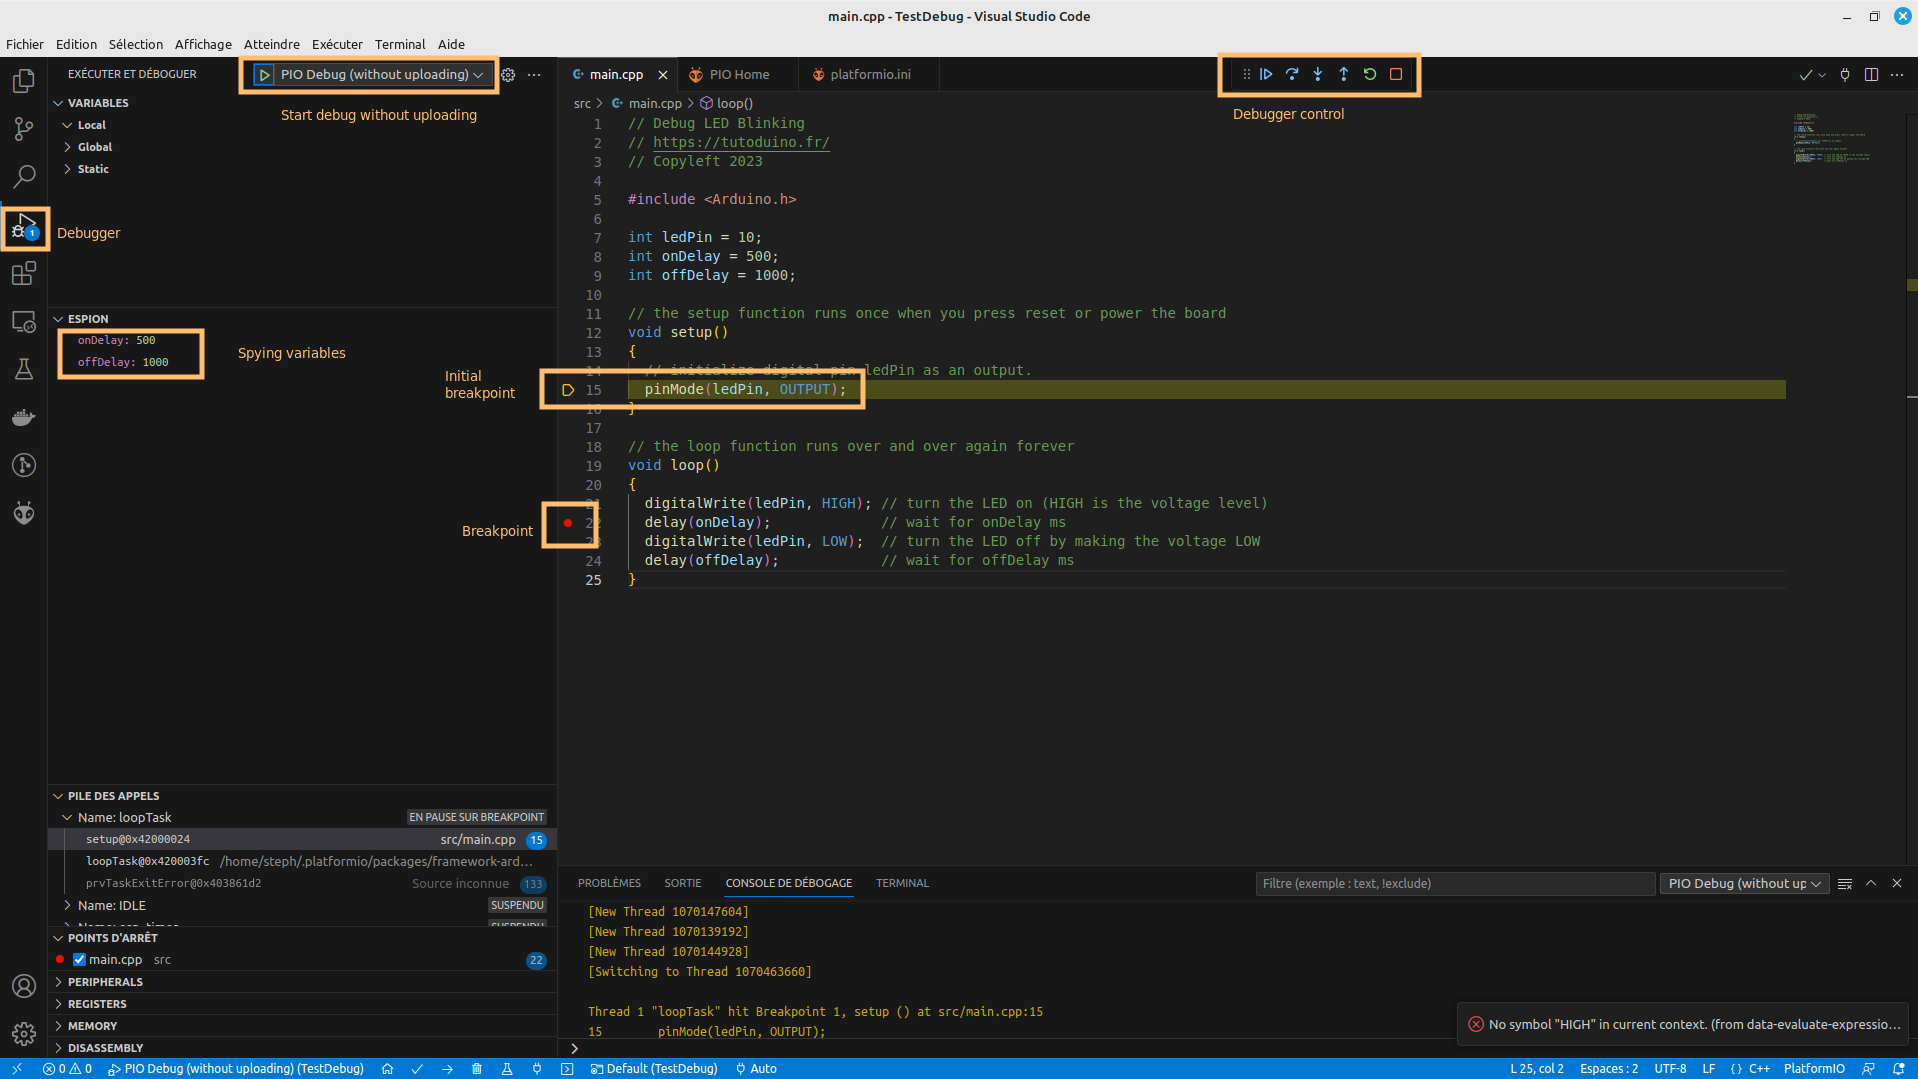
You have to build the program and upload it to the ESP32C3. Reset your ESP32C3 after upload is completed. Then you can start debugging the program by clicking on the debugger icon on the left side and clicking on PIO Debug (without uploading).
The program runs until the setup() function is called, we have indeed configured this initial debugger breakpoint in the platformio.init configuration file with debug_init_break = break setup.
You can then execute the program step by step, set other breakpoints, continue execution until the next breakpoint, inspect memory and variables… Enjoy!
This short video shows how to create the project, upload program to the ESP32C3 and start debugging:
Conclusion
As you can see, it is quite easy to debug a program running on ESP32C3 using internal JTAG adapter. It is very efficient to identify and solve bugs in your application.
I recommend that you read the Tips and Quirks page about debugging via JTAG on the Espressif site, and of course the GDB help.
If you are interested to learn how using external JTAG adapter, this tutorial might be of interest: https://tutoduino.fr/en/tutorials/debug-esp32/debug-esp32-wroom-platformio-jtag/
This tutorial is finished, do not hesitate to give your opinion and leave a comment, it will help me to improve it.